
A suburb’s population and household incomes can matter more to an investment decision than a headline growth figure. Population helps indicate the depth of the potential tenant pool, while household income can offer a sense of what rent local households may be able to sustain. In Australia, household income above A$3,000 per week is one demographic data point to consider, and investment property data and analytics are most useful when these signals are read alongside rental demand, yields, vacancy rates and local conditions.
It’s understandable to focus on price growth when weighing up a property, but past performance alone can’t show whether an area has lasting demand or suits your investment goals. This guide explains how to interpret investment property data and analytics, what the figures can reveal about price and rental potential, and where their limits matter.
You’ll see how population, income, historical growth and rental indicators fit together, and why suburb-level data needs local context before it informs a decision. The aim is a clearer, more balanced view of an opportunity, rather than a decision based on one appealing number.
Key Takeaways
- Read historical price growth as context, then weigh it against the area’s economic drivers and your investment timeframe.
- Assess rental demand alongside yields and vacancy rates to understand both potential income and the likelihood of finding tenants.
- Use population and household income as demand indicators, while allowing for local factors that suburb-wide figures may miss.
- Combine market data with on-the-ground insight to form a more balanced view of a property’s price and rental potential.
Historical price growth and rental income potential
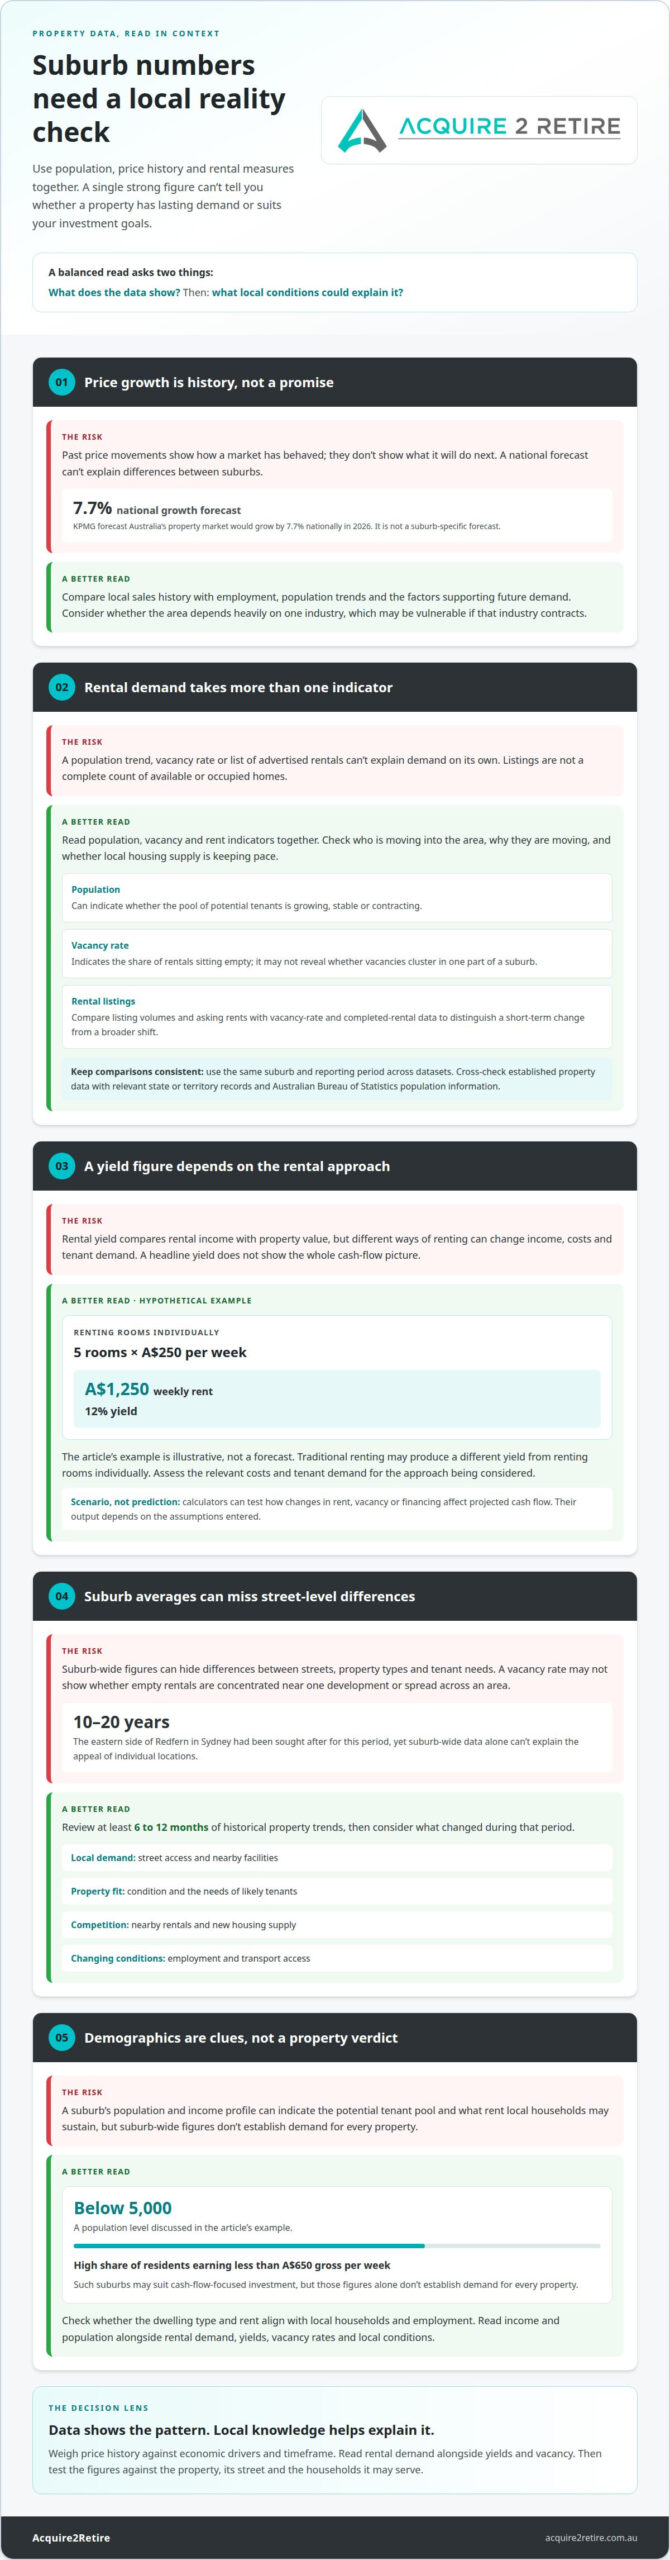
Past price movements show how a market has behaved, not what it will do next. KPMG forecast Australia’s property market would grow by 7.7% nationally in 2026, but a national forecast cannot explain differences between suburbs. Compare local sales history with employment, population trends and the factors supporting future demand before judging a property’s growth potential.
Consider the example of an Australian property bought for A$700,000 and later sold for A$770,000. That represents a A$70,000 capital gain, or 10%, before costs. Another hypothetical example projects a five-bedroom property bought for A$700,000 to reach A$1.5 million after 10 years, assuming annual growth of 8%. These are illustrations, not forecasts for a specific property.
Local history also shows why growth needs context. A market tied closely to one industry may be vulnerable when that industry contracts. Suburbs with low populations and low incomes may also be less suitable for investors seeking to extract equity within 2 to 3 years.
For infrastructure and growth corridor analysis, map planned transport links, employment areas, schools and essential services against established sales and rental patterns. Consider whether development improves access and supports enduring demand, or simply adds competing housing. Infrastructure can influence desirability, but its effect depends on timing, location and how it connects residents with jobs and services.
Australian analysis should account for income tax treatment, state or territory land tax, and rental rules that apply where the property is located. These affect net returns and cash flow, so include relevant obligations alongside income and holding costs. Property data subscription costs vary with coverage, update frequency and analytical tools; compare these features with the depth of data your decision requires.
Rental demand, yields and vacancy rates
Rental demand reflects how many households seek homes relative to available rentals. Read population, vacancy and rent indicators together to assess income potential.
Population trends and rental demand
Population trends indicate whether the pool of potential tenants is growing, stable or contracting. Growth can support demand, particularly where housing supply doesn’t keep pace, while population decline may weaken competition for rentals. Consider who is moving into an area and why, since household types and employment patterns influence which homes tenants need. These signals help explain whether local rental demand is broad or concentrated.
Rental yields and vacancy rates
Rental yield compares a property’s rental income with its value, while the vacancy rate indicates the share of rentals sitting empty. Compare Australian suburbs using both measures alongside capital growth history, checking that the periods and property types are comparable. In one hypothetical example, renting five rooms for A$250 each per week produces A$1,250 weekly rent and a 12% yield. Traditional renting may produce a different yield from renting rooms individually. Different rental approaches can change income, costs and tenant demand.
Rental listings and market data
Rental listings show homes being advertised, but they aren’t a complete count of available or occupied properties. Compare listing volumes and asking rents with vacancy-rate and completed rental data to distinguish a temporary increase in advertising from a broader shift. For Australian sales, rents and vacancy rates, use established property datasets alongside relevant state and territory government records and Australian Bureau of Statistics population information. Check that each dataset covers the same suburb and reporting period.
Cash-flow and investment calculators help assess how rent may balance against ownership costs. Enter expected rental income and relevant expenses, then test how changes in rent, vacancy or financing affect the result. Treat the output as a scenario, not a yield forecast: assumptions drive the calculation. Comparing alternative rent and vacancy inputs can reveal how sensitive the property’s projected cash flow is to changing conditions.
Combining data analysis with on-the-ground knowledge
Suburb-level figures help identify patterns, but they can hide differences between streets, property types and tenant needs. Investment property data and analytics work best alongside local knowledge, which helps explain why a suburb’s numbers look the way they do. A vacancy rate, for example, may not show whether available rentals are concentrated near one development or spread across an area.
Start with a consistent data window: review at least 6 to 12 months of historical property trends. Then consider what changed during that period, such as new housing supply, shifting employment or improved transport access. A price rise without durable demand drivers may tell a different story from steady growth supported by local jobs and services. Local context gives the figures meaning.
Redfern shows why neighbourhood knowledge matters. The eastern side of Redfern in Sydney had been sought after for 10 to 20 years, yet suburb-wide data alone can’t explain the appeal of individual locations. Street access, nearby facilities, property condition and competing rentals can all shape tenant interest. These details help distinguish an attractive address from a strong investment fit.
Demographic data also needs careful interpretation. Australian suburbs with populations below 5,000 and a high share of residents earning less than A$650 gross per week may suit cash-flow-focused investment, but those figures don’t establish demand for every property. Consider whether the dwelling type, rent and local employment align with the households in the area.
AI can organise large datasets and highlight patterns, but it should remain a research aid, not the decision-maker. Check its conclusions against local conditions, including current rental listings, nearby construction and the character of the street. Property signs with QR codes can provide buyers with key details, but those details still need neighbourhood context. A sound assessment brings data and place together, then tests whether both support the same investment rationale.
Property data used in investment decisions
Useful analysis connects property, household and suburb indicators rather than relying on a single headline figure. The important question is how each measure supports the investment’s intended role.
Investment analytics platforms
Australian property analytics platforms bring together sales estimates, rental trends, suburb comparisons and demographic information. Dashboards can help investors filter locations and identify patterns, while calculators model possible income and costs. Their value depends on the coverage and measures they provide, so focus on data relevant to your property type and investment aims. Treat a dashboard as an organising tool, not a substitute for understanding local conditions.
For example, one dashboard analysis identifies A$200K-A$600K as the price range dominating deal volume, while properties priced at A$1M or more drive value. Waterfront homes attract a large premium despite representing about 0.75% of listings. These patterns describe a market distribution, not a recommendation to buy in either price bracket. They help frame questions about local demand, competition and the type of asset being assessed.
Data risks and limitations
Suburb averages can conceal differences between streets, dwelling types and household groups. Weekly household income above A$3,000 may be a useful demographic indicator, but it doesn’t show what every household can afford. Likewise, suburbs with populations below 5,000 and a high share of residents earning less than A$650 gross per week may suit cash-flow-focused investment, but that profile alone can’t establish rental demand for a particular property.
Data can also reflect different reporting periods, definitions and sample sizes, making comparisons misleading. A high asking rent isn’t the same as achieved rent, and a price estimate isn’t a completed sale. Check what each metric measures, then interpret it alongside property characteristics and local market evidence. Artificial intelligence can help organise analysis, but local context remains essential to a sound decision.
Use property analytics to narrow the questions, then build a strategy around the evidence that matters to your goals. Discuss your investment strategy when you’re ready to connect market signals with an acquisition plan.
Acquire2Retire
Acquire2Retire helps Australian investors connect property research with a considered investment strategy. When price growth, rental demand and local indicators point in different directions, Planning & Strategy can help align the evidence with your portfolio goals and investment timeframe.
From there, Acquisition and tailored Finance support the move from an investment decision to a purchase plan, while Tenancy coordination and ongoing support help carry the strategy forward. This broader perspective is useful when you’re weighing more than one market signal or considering how a property fits alongside your existing plans.
If you’d like support applying property data to your investment decisions, contact Acquire2Retire to discuss your goals.
Turn your research into a clear investment plan
The next step is to decide what you need a property to contribute to your broader financial goals. A clear investment brief can help weigh trade-offs, set priorities and keep attractive market signals in perspective. Well-structured investment property data and analytics can inform that process, but the decision should still reflect your circumstances, timeframe and appetite for risk.
Acquire2Retire can bring Planning & Strategy, Acquisition and Finance into one considered pathway, helping connect your investment goals with the decisions that follow. If you’re ready to talk through how your research fits your plans, contact Acquire2Retire to discuss your plans.
A thoughtful next move begins with a clear conversation, and you can take it at your own pace.
Frequently Asked Questions
How do population and household income affect the demand and desirability of a suburb?
Population growth can widen the pool of potential buyers and renters, while household income helps indicate residents’ capacity to pay for housing. Consider the mix, not just the totals: new households may seek different property types from established families, and income levels can influence suitable rent ranges. For example, a suburb gaining smaller households may see stronger demand for compact homes than larger family properties.
What insights can you get by combining different data points?
Combining indicators can show whether a market’s apparent strength has more than one supporting factor. For example, rising rents alongside stable listing activity may suggest a different balance from rising rents alongside a growing supply of advertised homes. Comparing property type, sales activity, household characteristics and employment context can help explain the pattern and highlight where a suburb-wide average may conceal weaker pockets.
What key data should investors assess when evaluating an Australian investment property?
Assess comparable sales, property condition, achievable rent, vacancy trends, household characteristics and the costs that shape ongoing cash flow. Then consider how the property fits your borrowing capacity, investment timeframe and portfolio objectives. A practical example is comparing two similar homes: differences in layout, maintenance needs or access to everyday services may affect tenant appeal, even when both sit within the same suburb.
What are the current median house and unit prices and rental yields by Australian city and suburb?
There isn’t one median price or rental yield for each city or suburb, because results depend on dwelling type, location and reporting period. A house median can differ substantially from a unit median within the same market, while yields change with both sale values and rents. Compare like with like, using the same property category and period, and distinguish suburb-level medians from individual property evidence.
How do Australian property analytics platforms estimate property values and forecast growth?
Automated valuation models generally use available sales evidence and property characteristics to estimate a value, while forecasts use market patterns and other indicators to project possible direction. The result depends on the quality, coverage and recency of input data. A standardised model may struggle to reflect a renovated interior, unusual layout or specific street advantage unless those details are represented in its underlying information.
How reliable are property market forecasts and automated valuations in Australia?
Use forecasts and automated valuations as reference points, not as substitutes for a property-specific assessment. Their usefulness depends on comparable sales, accurate property details and conditions in the relevant local market. A model may not capture a home’s renovation quality, unusual features or nearby changes. Comparing its estimate with recent comparable transactions and the property’s individual characteristics gives a more grounded basis for interpretation.